


Scope 3 reporting is a longwinded process that depends on the data that you can collect, its kind, and its granularity.
While it’s tricky, the good news is that it’s totally learnable. Read on to learn how.
- What is scope 3?
- Why it’s important
- How do you identify and categorise scope 3 emissions?
- How do you prioritise data collection for reporting?
- How do you collect the relevant reporting information?
- How do you calculate emissions?
- How do you calculate emissions across different categories?
- Next steps (and your free consultation!)
What is scope 3?
Scope 3 involves reporting on emissions along a product’s life from manufacture to sale, in the Corporate Value Chain as part of emissions reporting.
The official definition of scope 3 for the GHG protocol is “indirect emissions (not included in scope 2) that occur in the value chain of the reporting company, including both upstream and downstream emissions.”
Why it’s important
Many companies already report on their scope 1 (direct emissions) and scope 2 (purchased electricity) emissions. By including scope 3, you can understand your value chain emissions and identify more opportunities to reduce the impact of activities beyond your operations.
It also allows for more precise reporting. For example, production and manufacturing emissions for scope 3, can account for over 2/3rds emissions. Failing to calculate them, damages report accuracy.
Scope 3 is also key for investors, for full transparency and regulatory compliance. Many companies choose to outsource production to decrease energy use emissions. While outsourcing production to a third-party supplier decreases scope 2 emissions, it vastly increases the emissions in upstream purchased goods and services, and product transportation. Measuring scope 3 emissions accounts for the increase in emissions further down the value chain.
How do you identify and categorise scope 3 emissions?
There are 15 categories in Scope 3, 8 of these are associated with upstream emissions, covering the product from its base components and manufacturing to when it leaves the factory.
The remaining 7 categories focus on downstream emissions linked to the distribution and use of sold products.
Upstream
Purchased goods and services
Extraction, production, and transportation of goods and services purchased or acquired by a company in the reporting year, not otherwise included in categories 2-8.
Capital goods
Extraction, production, and transportation of capital goods purchased or acquired by the company in the reporting year.
Fuel and energy related activities
Extraction, production, and transportation of fuels and energy purchased or acquired by the company in the reporting year, not already accounted for in scope 1 or scope 2.
Upstream transportation and distribution
Transportation and distribution of products purchased by the company, by vehicles not owned or controlled by it.
Waste generated in operations
Disposal and treatment of waste generated by the company in facilities that it doesn’t own or control.
Business travel
The transportation of employees for business-related activities in vehicles not owned or controlled by the company.
Employee commuting
Transportation of employees between their homes and worksites in vehicles not owned or operated by the reporting company, such as trains and busses.
Upstream leased assets
Operation of assets leased by company, not included in scope 1 or 2.
Downstream
Downstream transportation and distribution
The transportation and distribution of products sold by the company in vehicles it doesn’t own or control.
Processing of sold products
Processing of intermediate products sold by the business. I.e., the scope 1 and 2 emissions of downstream companies that occur in processing.
Use of sold products
Emissions that result from the use of sold products of a company.
Direct use: emissions from using products, such as the scope 1 and 2 emissions of end-users including fuel or electricity consumption.
Indirect use: emissions from products that indirectly consume energy, for example the washing of clothes and the cooking of food.
End-of-life treatment of sold products
The end-of-life treatment and waste disposal of a company’s products i.e. the scope 1 and 2 emissions of the waste management company that processes them.
Downstream leased assets
The operation of assets that are owned by the reporting company (leaser) and leased to other entities. I.e., the scope 1 and 2 emissions from leased assets operation.
Franchises
Operation of franchises, not included in scope 1 and 2, reported by the franchisor.
Investments
The operation of investments, including equity and debt investments and project finance.
The process
Now that you know what you’re looking at, it’s time to get started with your scope 3 emission calculation and reporting.
Remember to record your process, so that you can compare your efforts over time.
The basic process goes like this:
- Screening
- Decide which areas need what data
- Collect the data
- Use proxy data or extrapolation if data is gone
- Calculate emissions using appropriate methods e.g hybrid
- Report on your results including what methods were used for transparency
How do you prioritise data collection for reporting?
Because scope 3 reporting is a long process, it’s important to prioritise the data that you collect. It will also help you to find GHG reduction opportunities.
One way to prioritise data collection, is to identify activities that are expected to be emissions hotspots. To find hotspots, your company should begin with a screening process using broad data for each scope 3 category. Once your initial screening has taken place, you can examine each category to determine whether it needs refining.
Your company’s largest carbon footprint contributors should be calculated with more precise data and calculations. While less accurate data and calculation methods may suffice for small contributors.
Similarly, categories which are central to your products value chain and business goals, might need more precise, and labour-intensive data collection.
8 considerations for prioritising scope 3 activities:
- Size; a company’s size, is a significant determinant of expected emissions.
- Influence; the potential to reduce the company’s emissions.
- Risk; the activities which add to a company’s climate related risks.
- Stakeholders; how critical activities are to key stakeholders e.g customers and suppliers.
- Outsourcing; outsourced activities, which are typically performed in house by other organisations in the companies’ sector.
- Sector guidance; activities which are significant according to sector specific guidance.
- Spending or revenue analysis; areas which require high levels of spending or create ample revenue.
- Other; they meet additional criteria for the company or industry sector.
How do you collect key reporting information?
Products are often linked to vast numbers of suppliers, making collecting data for emission categories difficult.
You should aim to collect activity or emissions data that’s as specific as possible. Most carbon reporting data can be found in purchase ledgers or internal finance documents, but scope 3 reporting can require additional information from other sources. as emission factor databases.
Primary and secondary data
Companies collect two main types of data for reports, primary and secondary.
Primary data is particular and collected from specific activities within a company’s value chain. Such as the carbon emissions linked to the purchase of a particular item.
Secondary data doesn’t come from specific activities in a value chain. It’s not directly collected, measured, or estimated and is sourced from a third-party inventory database.
Whilst it’s less specific than primary data, it allows you to calculate minor emission sources with ease. For example, you might use an industry standard emissions factor to run a spend-based calculation for a CO2e estimate.
Primary data advantages:
- You can use GHG reduction strategies including supply chain GHG management and performance tracking for value chain partners.
- Reflects operational changes due to emission reduction measures at individual facilities and companies.
- Expands GHG transparency and supply chain management to the companies that control emissions.
- Allows businesses to better track GHG reduction goals by tracking the impact of company and product-specific improvements.
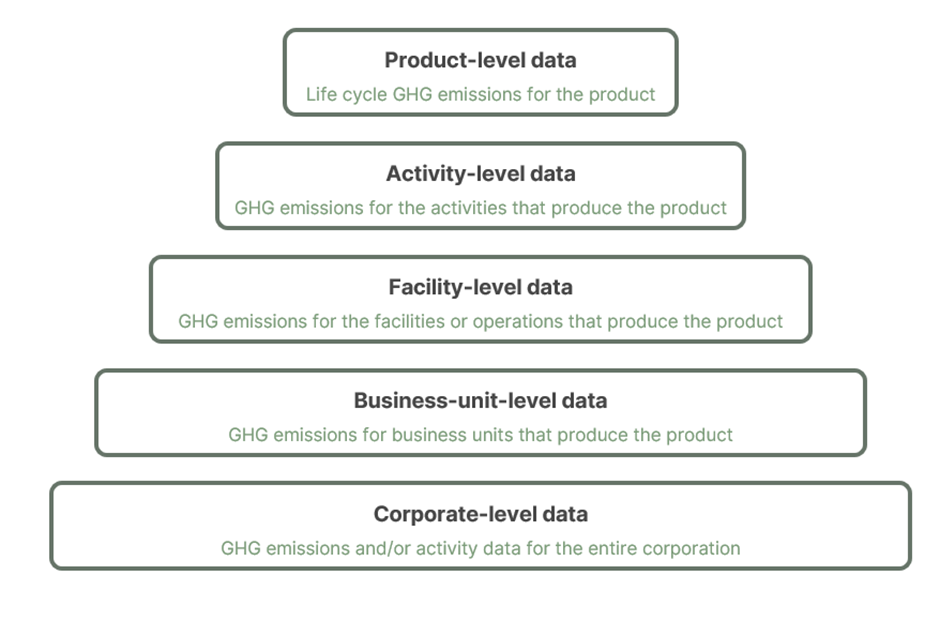
Levels of primary data
GHG standard guidance for the primary data collection phase in order of specificity:
Secondary data advantages:
- Allows companies to calculate emissions when primary data is poor quality or unavailable.
- Enables the estimation of a company’s operational GHG impacts further upstream and downstream.
- Allows businesses to understand the relative magnitude of scope 3 activities, identify hotspots and prioritize investments in primary data collection, supplier engagement, and GHG reduction efforts.
Sometimes, collecting secondary data is appropriate, and as more companies choose to use publicly available breakdowns from websites to report on their emissions, it’s getting easier to do.
You should take extra care at this stage, to avoid double counting emissions values.
Main types of data collection
Environmentally extended input-output (EEIO) and Process-based are two types of industry reporting data collection.
You can combine them for scope analysis for a detailed breakdown of emissions across scopes depending on the information available.
Businesses are required to report the source of their data and the type of data collected for continuity and future evaluations.
Environmentally extended input-output data
The process model estimates energy and emissions use from production and upstream supply chain activities for different sectors and products. The resulting emissions factors can be used to estimate ‘cradle-to-gate’ emissions.
Model outputs are typically in ‘per unit of revenue’ for all industries. Using EEIO data is simpler to execute, takes less time, and allows for a comprehensive look at the economy.
However, EEIO data is unrepresentative, encourages assumptions and makes it difficult to measure reduction efforts. Additionally, data might not be available for areas where reporting is not mandatory.
Process-based data
It’s sourced from assessing all known energy and environmental inputs and calculating process output emissions.
This is especially handy for individual product level analysis, allowing for a high level of specificity and detail. Because each analysis is so comprehensive it can take more time to complete calculations and collect data.
What if the data is not available?
If the correct data is not available, you can use proxy data to fill in the gaps, which can be scaled or customised to be more representative.
Proxy data is first grouped by similar characteristics such as location, then if the data is available an intensity metric is calculated, which can be used to fill the missing data gaps in reporting.
Sampling can also be used to understand a larger group of emissions values by taking a smaller sample size and then scaling as needed.
How do you calculate emissions?
Now that you’ve collected your data, it’s time to use it to calculate your emissions.
There are 4 ways to calculate emissions in a product or procedure, including the supplier-specific method, the hybrid method, average-data method, and the spend-based method.
The supplier specific method uses data specific to a supplier’s product, relying on product level consumption data from the supplier.
The hybrid method uses scope 1 and 2 data for a supplier’s product while all other upstream emissions are either supplier-specific or averaged. It involves collecting information directly from suppliers and using it as secondary data to calculate scope 1 & 2 emissions, which are then allocated based on spend and product purchased.
The average-data method assumes that all emissions are based on secondary process data. It estimates emissions for goods and services by collecting data on the mass and multiplying by the relevant ‘secondary’ emissions factors such as the average emissions per unit of goods or service.
The spend-based method assumes that all emissions data is based on secondary EEIO data. The economic value of purchased goods and services is multiplied by corresponding factors to calculate total emissions. These calculations are based on EEIO data models.
How do you calculate emissions across different categories?
The diagram below details how each calculation method applies to product life cycle stages.
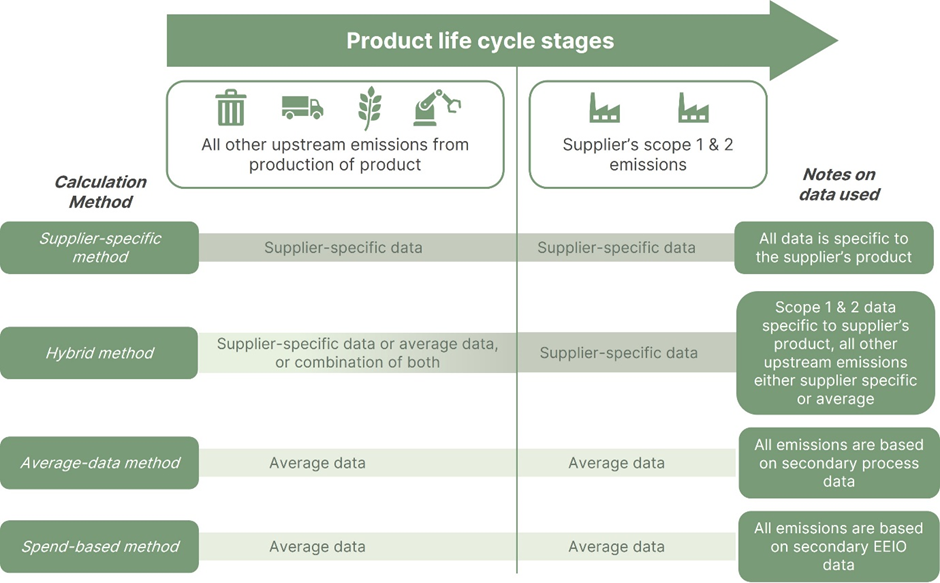
You can use a combination of data collection types depending on the data that you have.
The diagram shows the methods for each of the scope 3 activities including those of the supplier’s scope 1 and 2 emissions. The notes to the right detail the types of data methods used.
If more detailed data is available, then you can use the supplier specific method. However, if the information for a specific supplier is unavailable, you may need to use a spend-based method and obtain data from your purchase ledger and apply EEIO data factors.
For an accurate way to automatically collect detailed industry data, you can use accountabl’s revolutionary expense management system with CO2e tracking.
Accountabl calculates the emissions of your employee business purchases and travel in real-time, so you can focus your energy looking at other scope 3 emission sources.
See Accountabl Expense in action with a free demo.
For category specific calculations check out this nifty scope 3 calculation guide.
Next steps (and your free consultation!)
Now that you’ve gone through the process of deciding how to collect your data, gathered it, and calculated your scope 3 emissions, it’s time for a sigh of relief. Until next year, when you’ll have to do it all over again alongside your annual reports.
Before you go for your well-earned rest, remember to record your process so that you can accurately record your emissions and reduction efforts over time.
If you’re feeling unsure, or if you’re totally stuck, please get in touch with our friends at Rix Energy Services for your free consultation.
Your free consultation.


